
Financial maps

A new for this website: Financial maps
The financial maps provide a visual representation of key financial measures of financial markets worldwide.
The current version focuses on the following performance and risk measures:
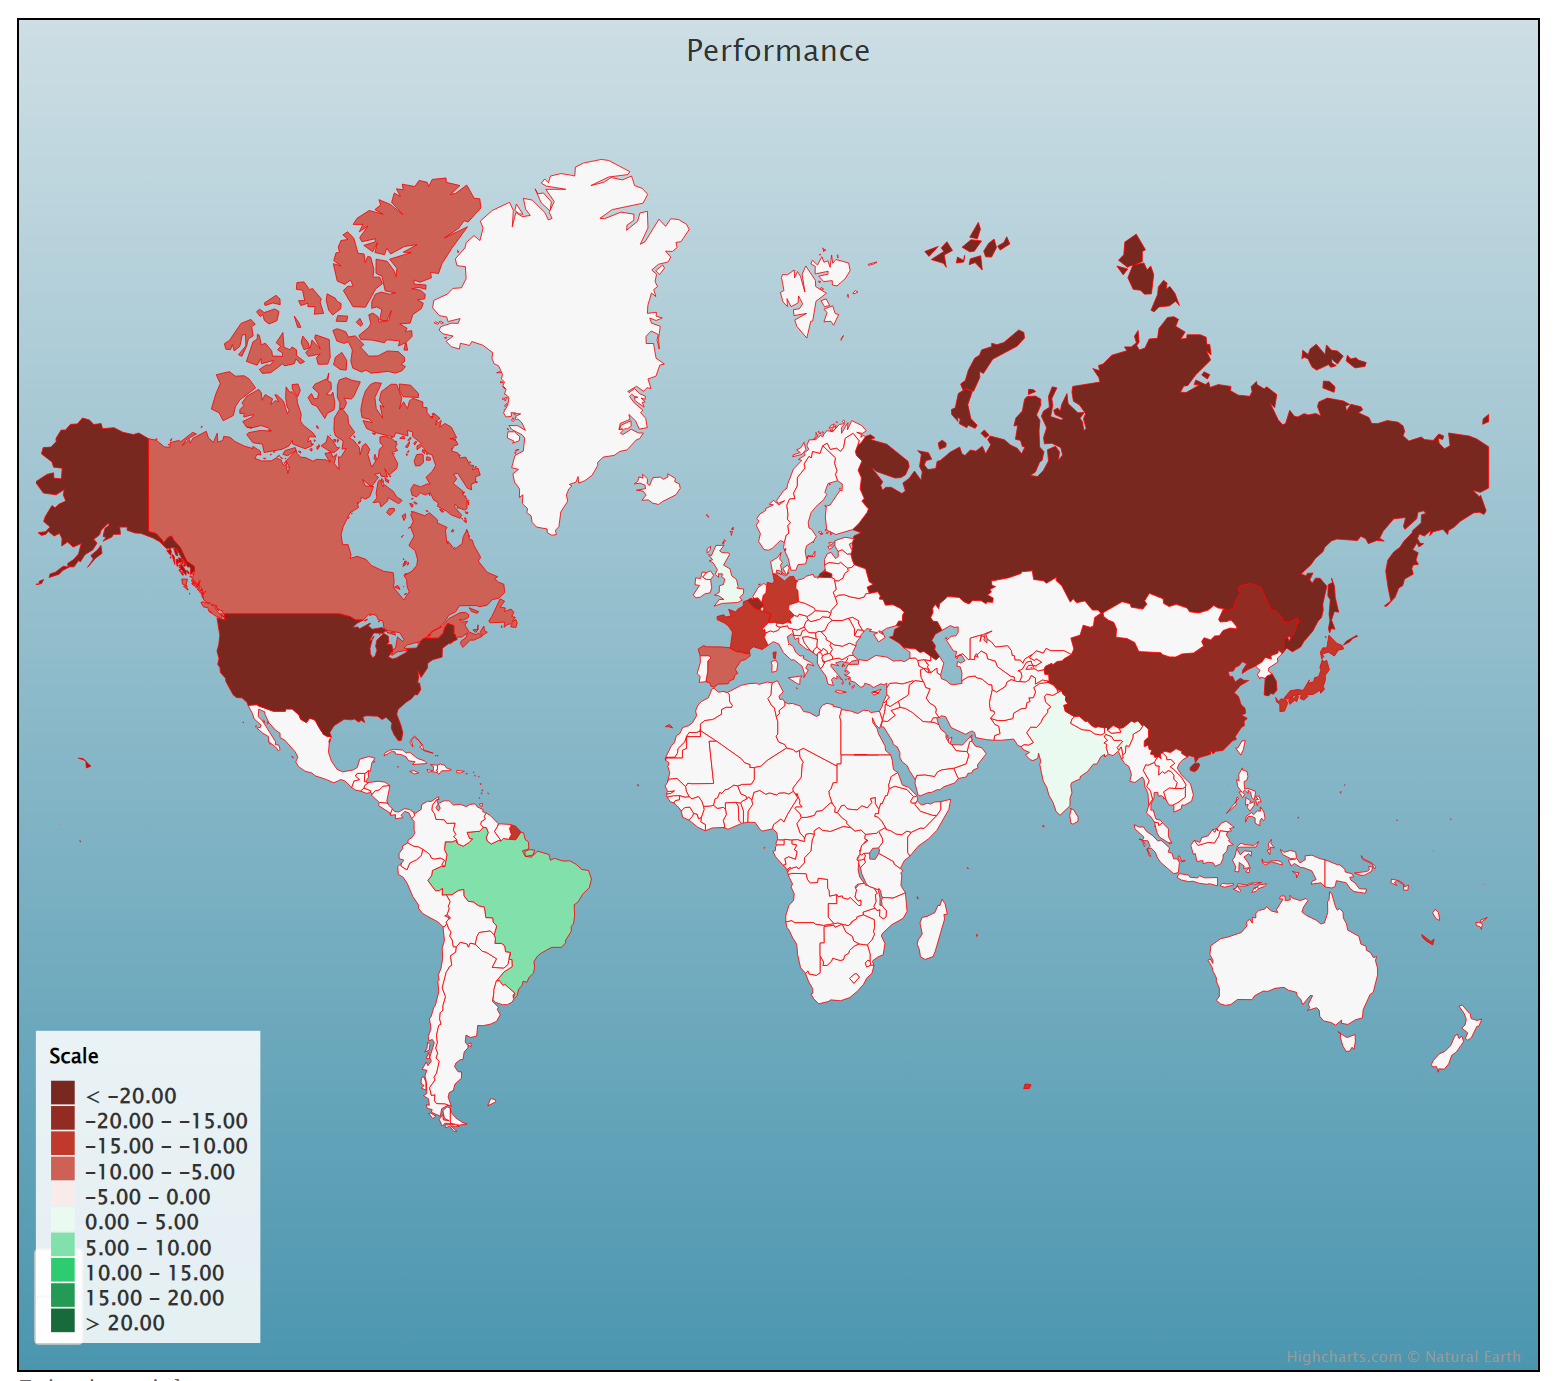
- Performance measured by the average return
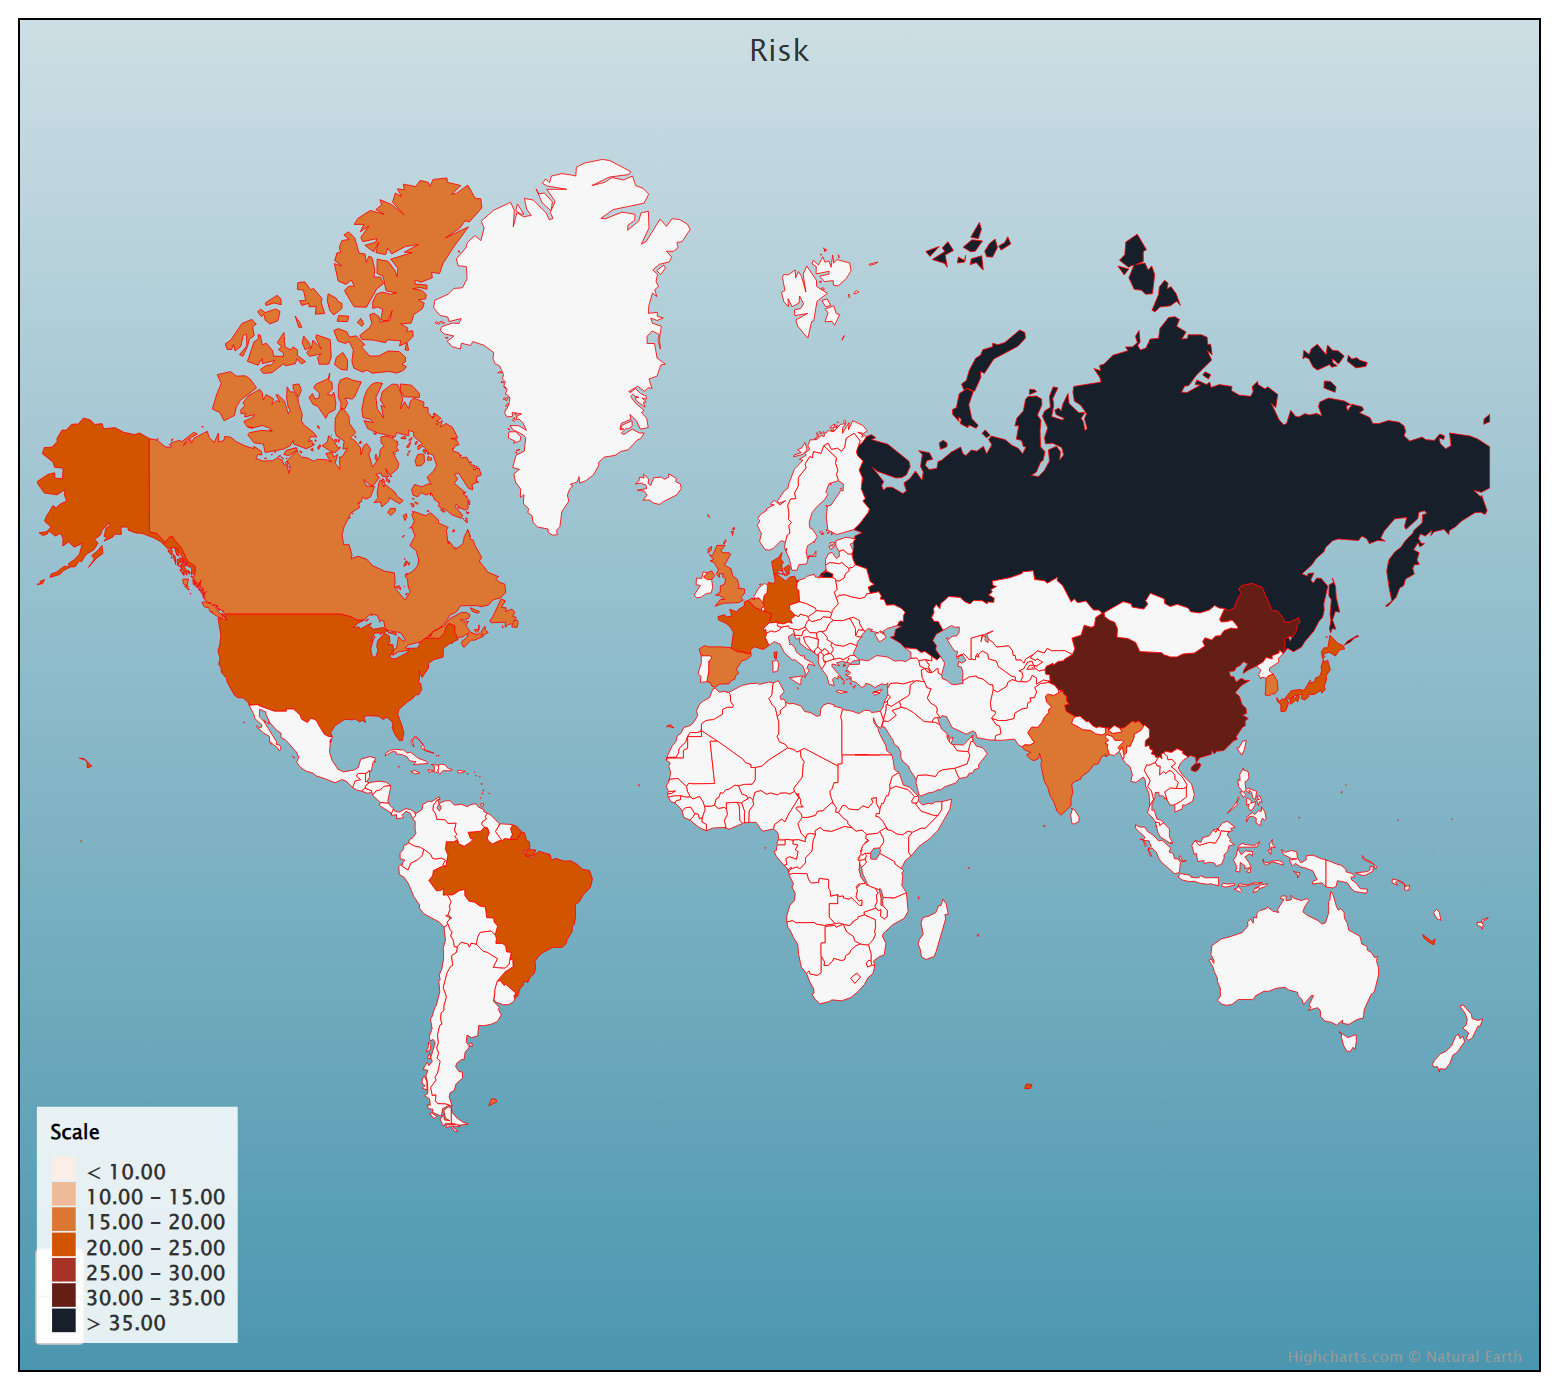
- Risk measured by the Value at Risk (VaR)
- Extreme risk measured by the Stress Value (SV)
You will find below an example of financial maps for the equity markets. For each country, we chose the equity index that best represented the national market.
Performance map
Risk map
Extreme risk map
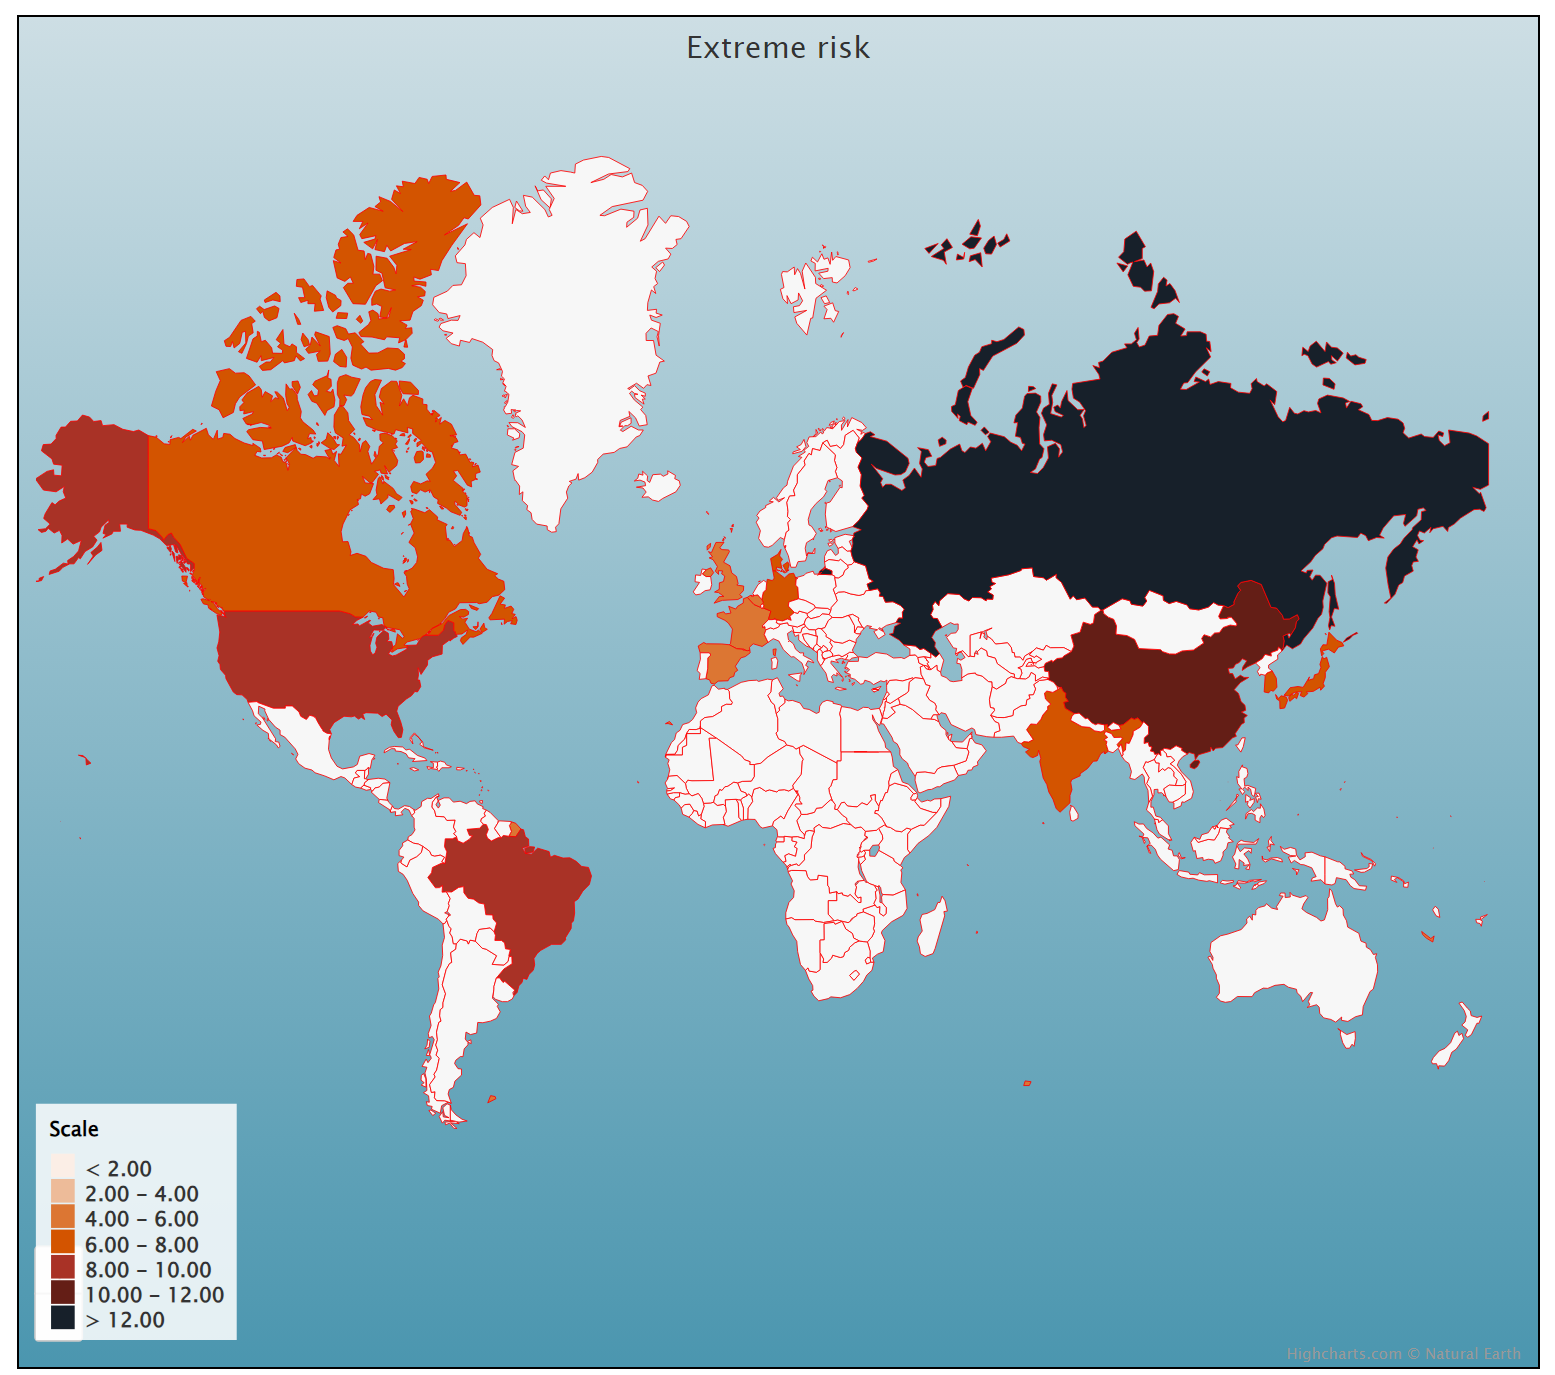
The financial map for extreme risk is based on the following academic research:
Longin F. (1996) The asymptotic distribution of extreme stock market returns Journal of Business, N°63, pp 383-408.
Longin F. (2000) From VaR to stress testing: the extreme value approach Journal of Banking and Finance, N°24, pp 1097-1130.
Longin F. and B. Solnik (2001) Extreme correlation of international equity markets Journal of Finance, N°56, pp 651-678.
Longin F. (2016) Extreme events in finance: a handbook of extreme value theory and its applications Wiley Editions.
This project will be regularly updated with new financial data and relevant measures.
More information about financial indexes
The basics to know about financial indexes:
▶ Calculation of financial indexes
▶ Float
Examples of countries covered by the financial maps:
▶ The United States The S&P 500 index
▶ China The CSI 300 index
▶ The United Kingdom The FTSE 100 index